
Fish Farming Cost: Four Structures, Four Budgets — and the Four Lines Nobody Prices
Why Every Fish Farming Cost Figure You Find Disagrees With the Next One
Spend an afternoon pricing a fish farm and you will hit a contradiction no page bothers to explain. One source puts start-up at a little over a hundred dollars. Another puts it past a hundred and fifty thousand. The pond-construction tables all list the same categories and disagree on every number inside them.
Those figures are not fighting each other. They are quoting different structures.
Land, excavation, pond lining, a pump, and the power to run it are the line items with the widest coverage across published fish farming cost guides. All five exist only if your fish live in a dug pond. Move the fish into a net pen on open water and four of the five vanish from the budget. That is not a saving. It is a different cost sheet.
What follows is a structural read with sources you can check, not a downloadable business plan template.
Four Ways to Hold a Fish, Four Different Cost Sheets
Every cost line belongs to a containment structure. The structure decides which lines exist before any number is attached to them. The four structures below carry four genuinely different sheets.
| Structure | Cost lines unique to it | Cost lines it removes | Check before you commit |
|---|---|---|---|
| Dug pond (earth / lined / concrete) | Land, earthwork, lining, pump, power | None | Confirm the site can refill by gravity or a nearby channel — otherwise pumping becomes a permanent line, not a start-up one |
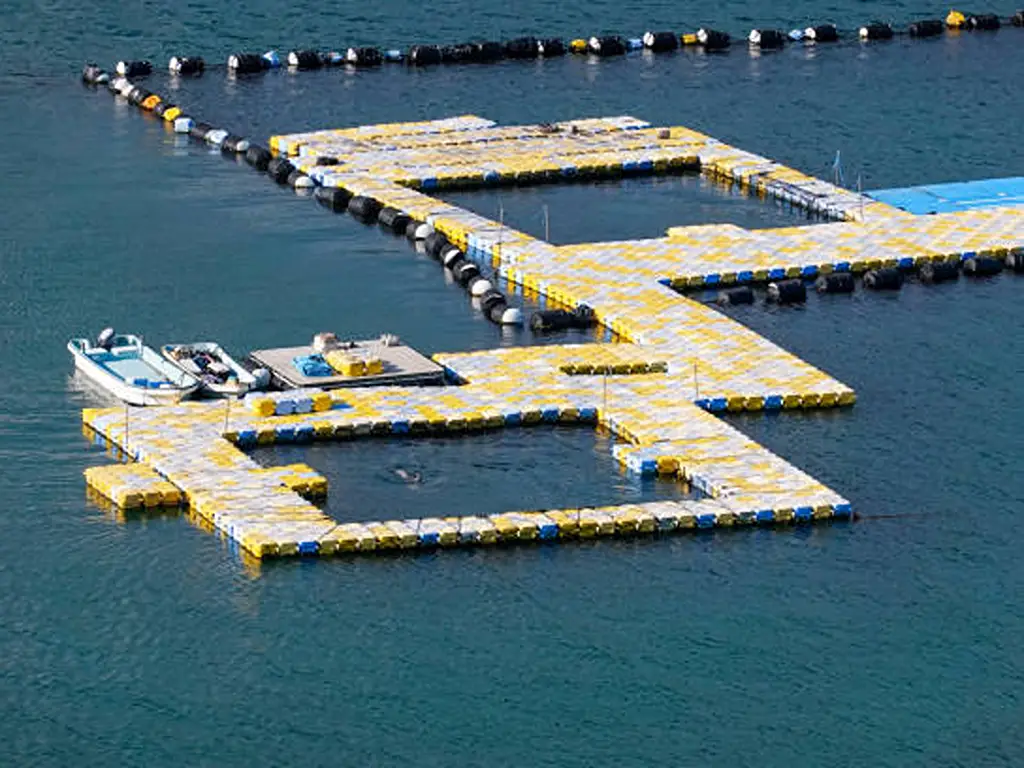
| Open-water net pen or cage | Floating work surface, cage and netting, mooring and anchoring, vessel time, water and power routing | Land, earthwork, lining, most pumping and power | Confirm you have both a usable water body and permission to occupy it — either missing closes the option regardless of cost |
| Land-based recirculating (RAS) | Building, biofiltration, sludge disposal, high-spec pumping and power | Land, and most water exchange | Confirm the target sale price supports 2–5x the per-kg production cost of ponds or net pens |
| Shared biomass layer (all structures) | Feed, fingerlings, medication, labour | None — present in every structure | Confirm which structure is setting your feed efficiency: stocking density and species cannot fix a containment problem |
A dug pond is the structure every public cost table assumes. Its unique lines are land, earthwork, lining, pumping, and power. It also carries an unpredictability most budgets ignore. Adjacent ponds managed identically still vary by a coefficient of variation around 20% on key production parameters, because a pond is a plankton-based ecosystem and not a controlled vessel (Engle, Journal of the World Aquaculture Society, citing Shell 1983). Two ponds, same feed, same stocking, different outcomes.
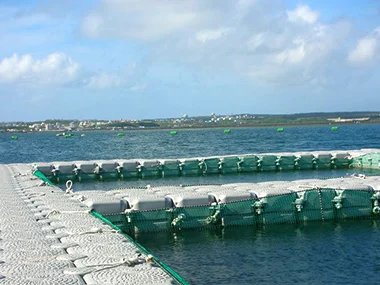
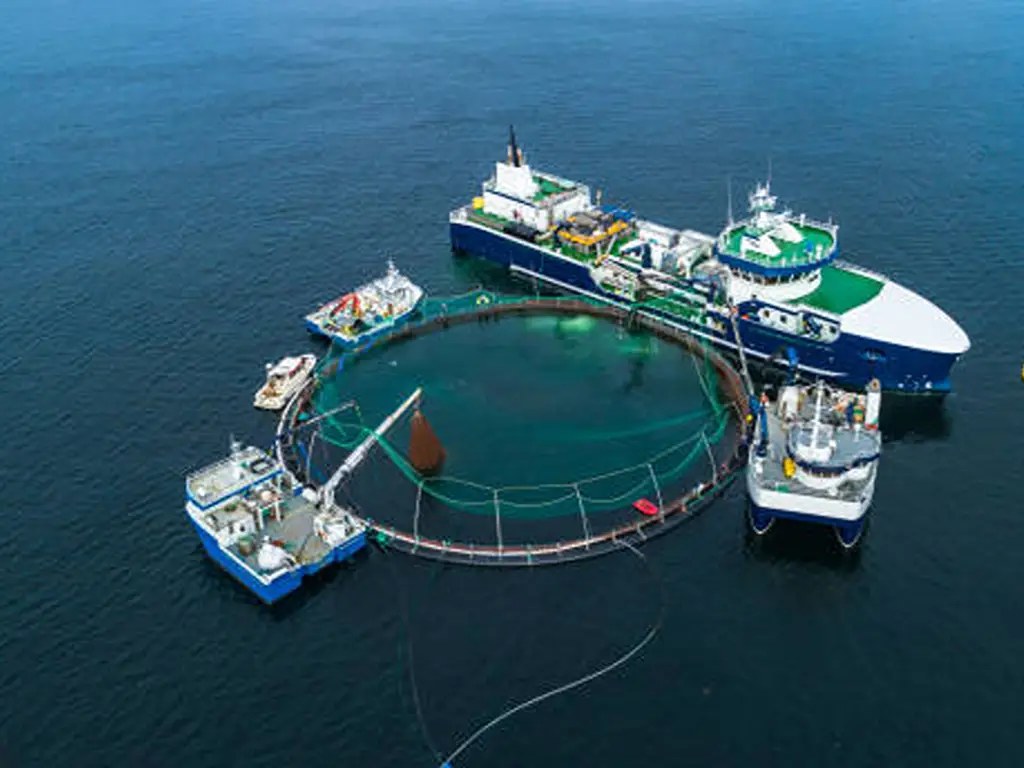
An open-water net pen or cage removes land and earthwork entirely and shrinks pumping and power to almost nothing, because the water body does the exchange for free. In their place come five new lines: the floating work surface, the cage and netting, mooring and anchoring, vessel time for installation and harvest, and the cost of bringing power and feed lines out to the pen.
A land-based recirculating system (RAS) takes water exchange to near zero and pays for it with capital and energy. Buildings, biofiltration, and sludge disposal enter the sheet. Pumping and power stop being minor lines and become the first and third largest cost drivers respectively.
The shared layer is where feed, fingerlings, medication, and labour live. Every structure carries them. What differs is the efficiency the structure forces on them. The same species produced 27 kg/m³ in cages and 0.63 kg/m³ in ponds in the same Ugandan districts, a 43-fold gap created by the containment choice rather than by the farmer’s diligence (Discover Sustainability, 2025).
Feed is normally quoted at 60–70% of total production cost. It is the one line every guide covers, and the one line you cannot move much from inside. Stocking density, aeration, fingerlings, and species behave the same way. They are present everywhere, and governed from above by the structure you picked.
Which Structure Actually Pays: What the Field Data Shows
This is the question the published cost tables never answer, because answering it requires putting three structures on one ruler. Two research programmes have done exactly that, on different continents, at different scales.
The cheapest cost per kilogram, ranked
A US study costing commercial-scale marine finfish across southern-tier states built enterprise budgets for four production scales. It covered 10 species in ponds, 13 in recirculating systems, and 5 in net pens. Per-kilogram production cost came out lowest for net pens, next for ponds, and two to five times higher in RAS than in either (Engle, Boldt, van Senten & Schwarz, Journal of the World Aquaculture Society 55:e3075, 2024).
The profitability split is sharper than the cost split. All five net-pen species were estimated to be profitable. Four of ten pond species were. Not one of the thirteen RAS scenarios reached profitability at the yields reported in the research literature.
Same study, same method, same year. Three completely different verdicts, and the only variable that changed was what held the fish.
A second continent, a second set of books
A survey of 169 small-scale farms around Uganda’s Lake Victoria basin reached the same ordering on the other side of the world. It covered 117 pond farms, 39 cage farms, and 13 aquaponics operations. Cage systems returned a benefit-cost ratio of 1.10 and a five-year net present value of USD 1,327. Ponds returned 1.03 and USD 267. Aquaponics returned 0.66 and a negative NPV of USD 3,150, and stayed negative even when operating costs were cut by 30% in sensitivity testing (Discover Sustainability, 2025).
Two details matter more than the headline. Cage systems ran two production cycles a year against the ponds’ one, which is why a higher operating cost still converted to a better return. And the strongest single predictor of whether a farmer adopted cages was access to finance, at a coefficient of 0.55, the highest of the three systems. The barrier to the best-performing structure is not feed or know-how. It is working capital.
The evidence that disagrees — and why it is not a contradiction
Older Asian survey work reaches a different emphasis. A seven-country study of freshwater aquaculture across Bangladesh, China, India, Indonesia, the Philippines, Thailand, and Vietnam concluded that freshwater fish farming is generally profitable in Asia. It found that semi-intensive polyculture and monoculture of carp and tilapia were best suited to resource-poor farmers, while higher-return carnivorous species were “too capital intensive” for them (Dey et al., Aquaculture Economics & Management 9:1–2, 2005).
Read carefully, this does not refute the cage result. The reason is worth internalising before you compare any two fish farming cost figures you find. That study measures ponds per hectare and cages per 100 m². Different unit areas, different species, different decades. The comparison is not head-to-head, and presenting it as one would repeat the exact error the cost tables make.
| US commercial-scale study (2024) | Asian seven-country survey (2005) | |
|---|---|---|
| What it measured | Enterprise budgets; per-kg production cost | Field survey; cost and returns |
| Unit area used | Per pond, per net pen, per m³ in RAS | Ponds per hectare; cages per 100 m² |
| What it found | Net pens profitable 5/5; ponds 4/10; RAS 0/13 | Freshwater farming generally profitable in Asia; carp and tilapia ponds best suited to resource-poor farmers |
| Comparable head-to-head? | No | No — different unit areas, species and decades |
The honest reconciliation is narrower. Cage and net-pen systems need two things a pond does not: a usable natural water body, and permission to occupy it. Where both exist, the field data favours containment in open water. Where either is missing, the question closes before cost enters it. The Ugandan authors attribute pond underperformance to “suboptimal input management”, a management problem rather than a verdict on ponds.
What the Open-Water Cost Sheet Actually Contains
If the data pushes you toward open water, here is what you are pricing.
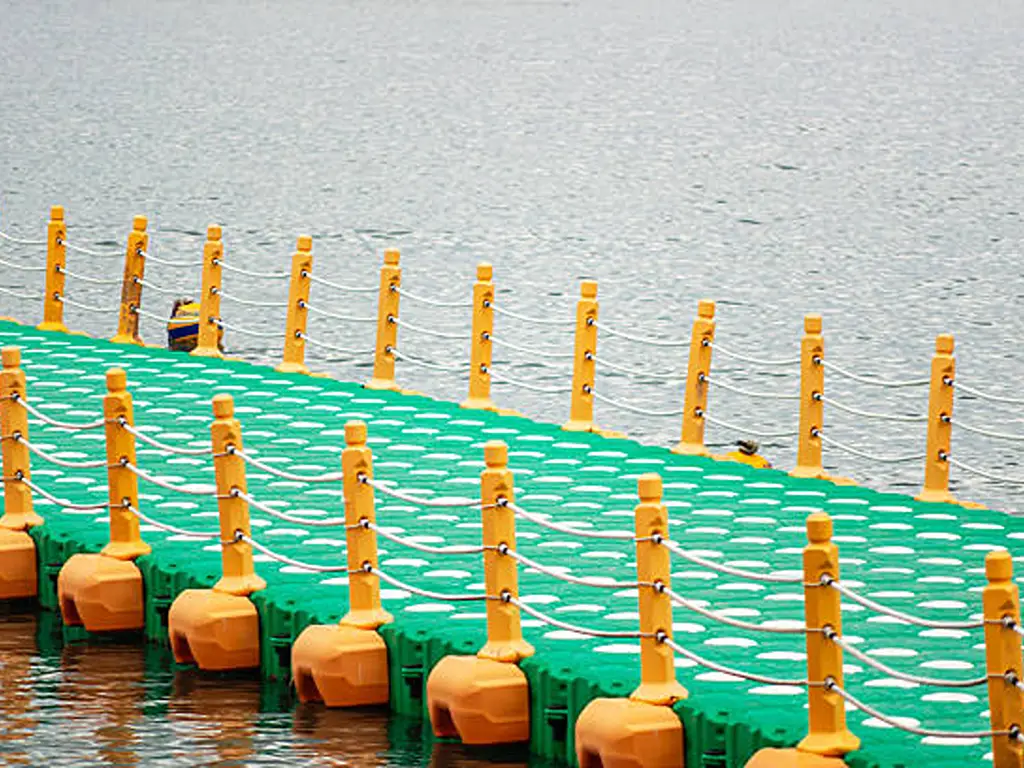
The floating work surface. This is the largest single capital line in most open-water builds, because it is the platform you feed from, harvest from, and walk on. Published ranges for high-molecular-weight HDPE modular systems run roughly $25 to $80 per square foot of structure. That figure explicitly excludes underwater anchoring, gangways, environmental permitting, and oversized freight.
The cage and netting. This sits separate from the platform, with a service life and replacement cycle a pond liner does not have.
Mooring and anchoring. This is where estimates break. Driving pilings from a barge runs on the order of $800 to $1,500 per piling once you account for the specialised driver and crew. Where bottoms are too deep or rocky for piling, the alternative is deadweight anchors. Anchoring is rarely mentioned in preliminary quotes and is frequently the difference between two bids on the same project.
Vessel time and freight. Modules ship by sea container, and how well they nest determines what you actually pay. Optimising the stack can lift container load efficiency by around 30%. That is a freight-line saving, not a product-line one.
Water and power routing. Feed and aeration equipment at a pen need lines run out to it, which is why pipe- and cable-carrying structures exist. If the sheet you were given has no line for it, the sheet is incomplete.
One structural floor belongs in any layout conversation. A usable walking platform must be at least three modules wide, or 1.5 m, for a stable working surface.
Notice that this entire sheet is capital, not consumables. That is why financing, not feed, showed up as the binding constraint in the Ugandan data. Ask for quotes per square metre of working surface, including anchoring and freight, not per float module. The module price is the number that tells you least.
The Four Lines Nobody Puts in the Budget
Every cost table above is a budget. None of them is a forecast. These four lines decide which it turns out to be, and none of them appears in the published breakdowns.
Permits: the cost that decides whether there is a business
Permits are mentioned in roughly a third of published fish farming cost guides, always qualitatively, never with a figure. The peer-reviewed finding is blunter than a missing number. Net-pen production “appears to be profitable in the United States, but effective permitting procedures are not in place” (Engle et al., 2024). Permitting is not another line item. It is the gate the whole sheet sits behind.
Insurance: converting an unknown loss into a known premium
Insurance appears in none of the ten cost guides reviewed. The industry’s own framing is the useful part. Insurance exists so a producer can “substitute a known cost in the form of an insurance premium for an unknown potential cost, the loss of stock” (Global Seafood Alliance). Stock mortality cover is specialty cover. It is priced farm by farm rather than from actuarial tables, so there is no rate you can look up. It has to be asked for, per site.
Mortality: why 15% is the most optimistic number in the room
The most widely copied investment example in the ranking content uses a 15% mortality assumption and carries it straight into its headline income figure. Against the literature, that number looks generous. Survival in commercial tilapia and catfish operations commonly runs 75% to 90%. Documented outcomes extend down past 30%. A single disease outbreak can add 42 to 50 percentage points of cumulative mortality on top of baseline. A projection built on 15% is not a conservative case. It is the best case wearing the base case’s clothes.
The price you sell at, against the cost you produce at
This line turns a good structure into a loss, and it is live now. In May 2025 Norwegian salmon exporters reported prices of NOK 58–65 per kilogram. One stated flatly that it was “now dipping below production cost for more and more players”. Another described losses of NOK 10 per kilogram. That is the flagship net-pen sector, in one of the world’s most established aquaculture industries. The best-performing structure available still loses money at the wrong price. That is why cost per kilogram and price per kilogram belong in the same sentence from the start, and the price is not yours to set.
One sector-level case makes the point about forecasts. South Africa’s commercial marine fish farming sector, reviewed as a whole, produced actual output at roughly 25% of projections. The official post-mortem named “excuses, a lack of data, data manipulation and misinformation” among the causes (Global Seafood Alliance). When the four lines above are missing, the projection absorbs the difference. On paper, until it does not.
Where Open-Water Containment Equipment Comes From
Open-water containment reaches you by one of two routes, and the route changes your cost sheet more than the product does.
Through a domestic distributor you buy from local stock at local margin, with short lead times and support in your own regulatory context. Through a factory you buy at manufacturing cost plus freight, with lead times measured in weeks and the freight bill set by how well the modules nest. Neither is automatically cheaper. The distributor route front-loads cost and back-loads risk. The factory route does the reverse. The trade between them is only visible if you price anchoring and container together with the structure.
Two operational facts decide it. Standard products ship quickly where stock exists, and take on the order of a week to ten days where it does not. Customised orders run around ten to fifteen days. Container loading is also a design variable, not a logistics afterthought. Modules that stack and nest can lift load efficiency by roughly 30%, which is the difference between a freight line that flatters the quote and one that survives the invoice.
What This Means If You Supply Aquaculture
If you sell to fish farmers, sell the structure first.
Your customer cannot find this comparison anywhere. Of eighteen results across the major fish farming cost searches, four mentioned cages at all and one gave a cage cost figure, a 2006 backyard estimate of about $100. Everyone else is quoting ponds. That gap is worth standing in, and the way to stand in it is to hand over a system cost comparison with a capital schedule attached, not a module price list.
The evidence for leading with the schedule is in the numbers above. Containment choice decides which cost lines exist and how profitable the system is. Access to finance, not feed and not know-how, was the strongest predictor of adopting the best-performing structure. Your customer’s real question is not what a square metre costs. It is what they have to put down, and when it comes back. Hiseadock publishes our modular system ranges at $25–$80 per square foot alongside the anchoring options and lead times that sit outside that figure, so the comparison can start from published numbers rather than a phone call.
Write the failure conditions in yourself, too. Open-water containment needs a usable water body and a permit to occupy it. Storm loading is a design input rather than an after-market upgrade. A structure that performs well can still be sold at a loss. A supplier who names those boundaries is easier to trust on the lines that fall inside them.
To compare a configuration against your site conditions, the team can be reached through our contact page, and Hiseadock’s dealer programme is open to distributors and installers working in aquaculture.
References
- Engle, C. R., Boldt, N. C., van Senten, J., & Schwarz, M. “Estimating Growout Production Costs of Commercial-Scale Marine Finfish Production in Southern Tier US States.” Journal of the World Aquaculture Society, 2024. https://onlinelibrary.wiley.com/doi/full/10.1111/jwas.13075
- Engle, C. R. “The Economics of Recirculating Aquaculture Systems.” Journal of the World Aquaculture Society. https://www.was.org/article/The-economics-of-recirculating-aquaculture-systems.aspx
- Discover Sustainability. “Comparative Assessment of Pond, Cage and Aquaponics Systems in the Lake Victoria Basin, Uganda.” 2025. https://link.springer.com/article/10.1007/s43621-025-02147-z
- Dey, M. M., Rab, M. A., Paraguas, F. J., Bhatta, R., Alam, M. F., Koeshendrajana, S., & Ahmed, M. “Status and Economics of Freshwater Aquaculture in Selected Countries of Asia.” Aquaculture Economics & Management, 2005. https://www.tandfonline.com/doi/abs/10.1080/13657300590961609
- Global Seafood Alliance. “What You Should Know About Aquaculture Insurance.” Global Aquaculture Advocate. https://www.globalseafood.org/advocate/what-you-should-know-about-aquaculture-insurance/
- Global Seafood Alliance. “South Africa: A Cautionary Tale.” https://www.globalseafood.org/advocate/south-africa-cautionary-tale/
- SalmonBusiness. “Salmon Prices Plunge to New Low, Falling Below Production Cost for Many Farmers.” https://www.salmonbusiness.com/salmon-prices-plunge-to-new-low-falling-below-production-cost-for-many-farmers/
- Washington State Department of Natural Resources. “Cypress Island Atlantic Salmon Pen Break.” https://dnr.wa.gov/aquatics/aquatic-stewardship/cypress-island-atlantic-salmon-pen-break
- Hisea Dock. “Modular Floating Dock Systems Manufacturer.” https://www.hiseadock.com/
- Hisea Dock. “Become a Dealer.” https://www.hiseadock.com/become-a-dealer/
- Hisea Dock. “Cage Fish Farming Solutions.” https://www.hiseadock.com/waterfront_solutions/cage-fish-farming/
- Hisea Dock. “Custom Cage Fish Farming Solutions.” https://www.hiseadock.com/custom-cage-fish-farming-solutions/
- Hisea Dock. “How Much Does a Floating Dock Cost? The Ultimate Price Guide and TCO Breakdown.” https://www.hiseadock.com/floating-dock-cost-guide/
- Hisea Dock. “How Much Does a Modular Dock Cost? From $25/Sq.Ft to Hidden Fees Revealed.” https://www.hiseadock.com/modular-floating-dock-prices-guide/
- Hisea Dock. “Frequently Asked Questions.” https://www.hiseadock.com/faq/
- Hisea Dock. “Modular Floating Dock Products.” https://www.hiseadock.com/products/
- Hisea Dock. “Contact Us.” https://www.hiseadock.com/contact-us/

 English
  Thai
Thai  Spanish
  French
  German
  Dutch
Dutch  Italian
  Arabic
  Indonesian
  Portuguese
  Turkish