
Fish Farming Market: The Numbers, the Growth, and What It’s Built On
Search for the fish farming market and you will meet the same industry described in three different sizes. One clarification: this is not a fish market in the market-stall sense. It is the industry that raises fish in ponds, raceways, tanks and net pens. How its scale gets reported is itself the first thing worth understanding. What follows treats the numbers as a starting point rather than an answer, working down from what the research houses say and why they disagree, to where the growth lands and what physical form it takes. It ends at the layer every project has to buy and build before any of it can happen.
The Fish Farming Market by the Numbers — and Why the Honest Answer Is a Range
Six research houses, six answers to the same question
| Source | Base-year value | Forecast value | CAGR |
|---|---|---|---|
| IMARC Group | USD 336.0bn (2025) | USD 479.7bn (2034) | 3.91% |
| Straits Research | USD 331.86bn (2025) | USD 532.75bn (2034) | 5.4% |
| Expert Market Research | USD 342.86bn (2025) | USD 596.85bn (2034) | 5.70% |
| Zion Market Research | USD 322bn (2024) | USD 450.96bn (2034) | 4.30% |
| Allied Market Research | USD 285.36bn (2019) | USD 378.01bn (2027) | 5.8% |
| Grand View Research (aquaculture) | USD 319.6bn (2025) | USD 447.1bn (2033) | n/a |
| Fortune Business Insights (aquaculture) | USD 653.88bn (2026) | USD 1,150.64bn (2034) | 7.32% |
Read the first column and the disagreement looks small. Measured around 2024–2025, the market sits somewhere between roughly USD 320 billion and USD 345 billion, and that band is stable enough to quote with confidence. The last two columns are where the trouble starts. Ten years out, the same industry is quoted at anywhere from USD 447 billion to USD 1.15 trillion, a spread of about 2.6 times. Growth rates connecting the two ends run from 3.91% to 7.32% (IMARC Group, 2026; Straits Research, 2026; Expert Market Research, 2026; Fortune Business Insights, 2026).
How to read any market figure
Three differences account for most of the distance. Base years differ: a 2019 base and a 2025 base are not measuring from the same line. Endpoint years differ: a 2027 forecast and a 2035 forecast are not the same claim. And scope differs: “fish farming” and “aquaculture” get used interchangeably, even though the second includes shellfish and seaweed. FAO, measuring the farm-gate value of farmed aquatic animals for 2024, lands on USD 371 billion, the same industry under yet another boundary (FAO, 2026).
There is a fourth gap, and it matters most to anyone building a business case: value versus volume. Value is what the industry is worth in dollars, dominated by a few high-priced species. Volume is what it produces in tonnes, and volume is where the physical requirements, and the structures, come from. When you quote a market figure, quote the range, name the base year, and treat the direction as the finding and the number as the decoration.
What every house agrees on is the part you can lean on: the direction is up, Asia-Pacific is the largest producing region, and freshwater is the largest environment. The demand drivers repeat too. Protein demand, a wild catch that has stopped growing, technical gains in feed and monitoring, and government support in producing countries all point the same way.
A global figure is context, not a forecast for your project. If the plan is one lake and one species, the number that matters is the row for your region, environment and species, not the total.
Where the Growth Actually Is: Region, Environment, Species
A market growing at four to six percent a year does not grow everywhere at once, and the research houses that disagree about totals largely agree about structure.
One market, two different sides
The value headline
Salmon holds the largest share by value.
North America 13.6% and Europe 15.2%, growing 4.7–4.9% a year
The volume growth
Asia-Pacific 56.8% of value, growing 6.12%
Tilapia 6.35%, the fastest species
LAMEA 6.96%, the fastest region
FAO: 103 million tonnes of farmed aquatic animals in 2024, 63% from inland freshwater.
Two splits matter more than the rest. By environment, freshwater is the largest at 45.9% of value, and FAO’s production data backs the volume side of that. Of the 103 million tonnes of farmed aquatic animals produced in 2024, 64.3 million tonnes, or 63%, came from inland freshwater systems (FAO, 2026). By species, salmon holds the largest share by value, while tilapia is the fastest-growing at 6.35%. That warm-water fish dominates small and mid-sized farms across Asia, Africa and Latin America.
Named players (Mowi, Cermaq, Cooke, Leroy, SalMar, Bakkafrost) mislead more buyers than any number on this page. They are vertically integrated salmon producers: their own cages, processing and vessels. If you are building a farm, or supplying the structures a farm stands on, these are not your competitors. Their growth curve is not the one your order book will follow. Place your customer on the value chain (production, structures, services) before benchmarking against a leaderboard.
The reverse side of the map is just as useful. Outside Asia the increment is thin. In the United States, the 2023 Census of Aquaculture counted 3,453 farms with USD 1.9 billion in sales, under one percent of the global total. IBISWorld’s industry series has US fish and seafood aquaculture revenue flat to declining across the five years to 2025 (USDA NASS, 2024; IBISWorld). A market that grows by adding farms is concentrated where farms are being added.
The value headline and the volume growth do not sit on the same side of this market. The money concentrates in salmon and the industrialized North; the tonnage, the farm count and the new working platforms rise fastest in Asia-Pacific, in freshwater and warm-water species, and on small and mid-sized farms that intend to grow.
What Form the Growth Takes: Pond, Raceway, RAS, or Cage
Fish are cultured in four basic systems: ponds, raceways, recirculating systems, and cages or net pens. The definitions matter far less than what each system demands, because demand is what decides where the growth can physically land. (The four-system grouping is the industry’s own; each type has a longer treatment here.)
| System | What it requires | Where it fits on the growth side | When it is the wrong answer |
|---|---|---|---|
| Pond | Land, suitable soil, water; lowest capital per unit | The default across Asia-Pacific smallholder and mid-scale freshwater farms | Land costs or availability close the site, or water quality cannot be managed |
| Raceway | Continuous flowing water and slope | Cold-water species where gravity flow already exists | Flow is seasonal or contested and pumping becomes the cost |
| RAS (recirculating) | Capital, reliable power, technical staff; not land, not a natural water body | Land-based salmon and trout near markets, e.g. Korea’s Busan cluster at 500 t/year recycling up to 99% of its water; India’s first RAS trout farm in Kashmir; Oman’s 8-tonne sea-bream project | Power is unstable or capital is thin: the running-cost structure, not the tank, is the gate |
| Cage / net pen | An existing water body (lake, reservoir, river, estuary or nearshore) plus mooring and a working platform | The fastest expansion route where land is unavailable and water exchange is free | Exposure exceeds the structure’s design regime, or the site’s permit rules exclude it |
Two rows deserve to be pulled out. First, the increment lands mostly on the pond and cage rows. Those signals point the same way: the fastest-growing regions, the freshwater majority and the warm-water species all favour systems that use existing water rather than build tanks on land. Second, exposed offshore water is a different engineering regime. A 2023 review of offshore fish-farm standards catalogues design guidance for offshore pens as still forming (Chu et al., JMSE 11(4):762, 2023), and commercial open-water farms run multi-cage grid moorings. The offshore story is real; it is simply not the same address as the increment.
Before committing to any row, three site facts decide more than the brochures do. Minimum water temperature has to suit your species. Local permit rules have to allow the system you are pricing. And anything powered has to sit where the grid is stable enough to carry the running cost.
What a Cage Farm Is Actually Built On: Three Layers of Working Structure
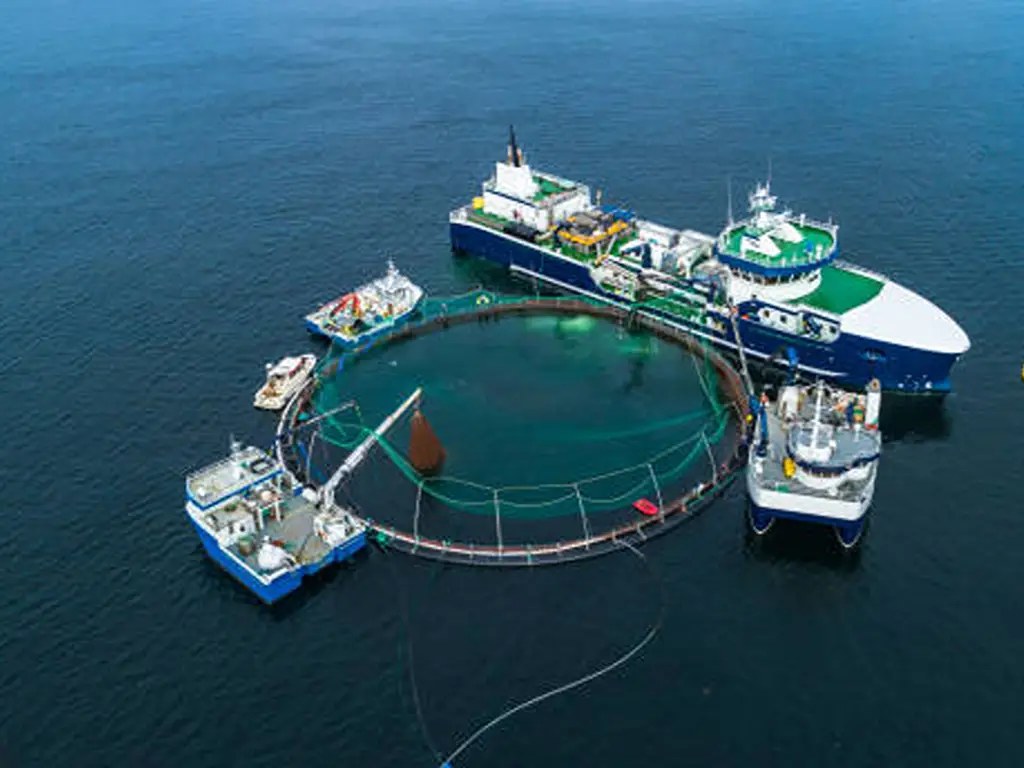
Once the form is cage-based, the market stops being an abstraction and becomes an order. A working net-pen farm stands on three structural layers, and each one carries a specification the farm’s operations depend on.
The cage and the net: what sits in the water
The first layer is the cage itself: a mesh enclosure that holds the stock while water passes through. Mesh size is the familiar trade-off, small enough that fish cannot escape and open enough for water exchange to keep oxygen and waste moving. Practitioners put it concretely: a 3/4-inch mesh holds a 3-inch bluegill, whose body depth is about one inch (Pond Boss Forum, 2015).
The second half of that trade-off is easier to miss. Smaller mesh fouls faster: algae grows over the openings, water exchange drops, and the cage has to be cleaned, which stresses the fish, and stressed fish grow more slowly. The mesh decision is not made once at purchase; it sets a maintenance cycle for the life of the cage. Handling stress is the quiet loss in cage farming, because a cage shows you every fish that dies. Leave at least 18–24 inches of water beneath the cage so flow is never blocked.
The walking and working surface: the layer that carries people
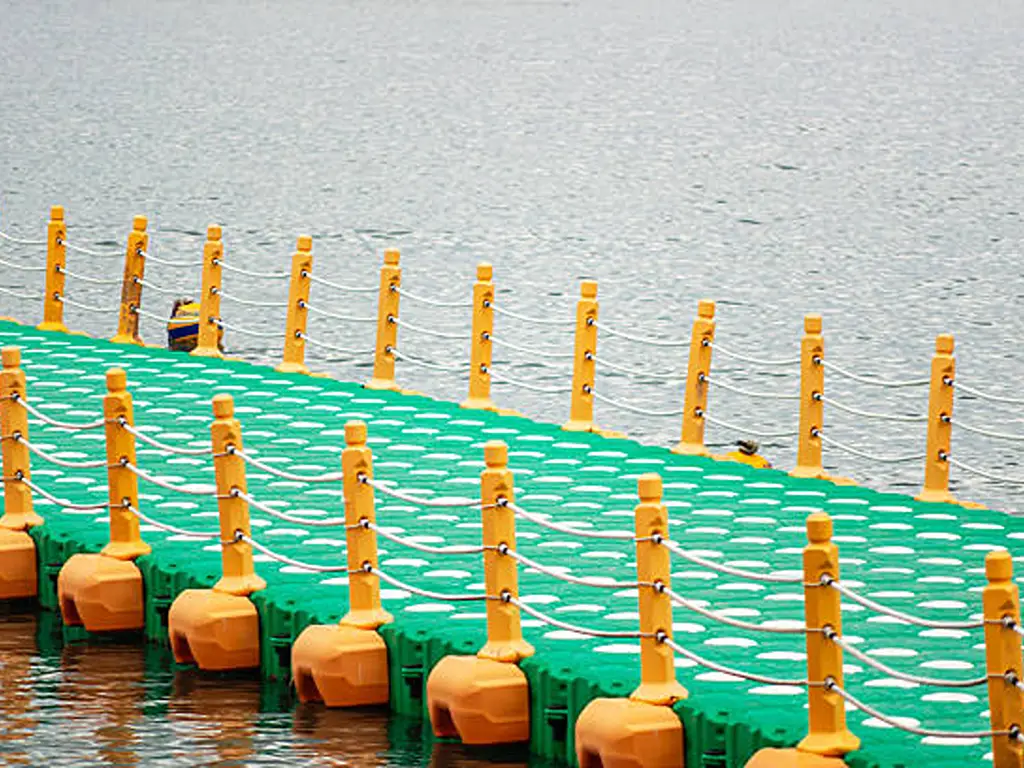
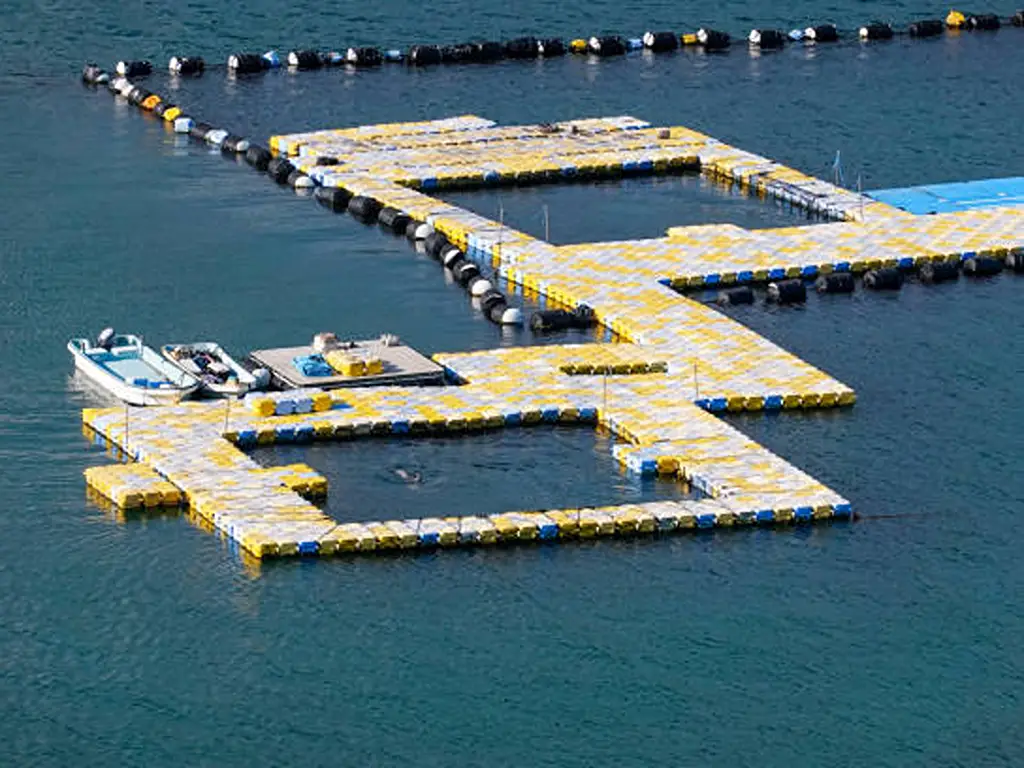
Feeding, inspecting, sampling and harvesting all happen at the cage edge, which means people, feed and tools have to stand somewhere. In practice that is a walkable platform: a working surface integrated with the cage collar, or carried on modular floats.
Load ratings in this product class are published as surface loads, in kilograms per square metre, as distinct from the single-point load a bracket or landing point can take. Hisea Dock’s published bands run from 200 to 420 kgs/m² by float type. A standard 500 × 500 × 400 mm float is rated 350 kgs/m², roughly 90 kg (200 lb) across its quarter-square-metre footprint, matching the single-cube capacity the company publishes alongside it. Those are area ratings; the conversion is arithmetic, not a per-point guarantee, and a concentrated or landing load has to be requested from the factory in writing. (our modular HDPE float range)
Width gets settled here too. One published rule puts the minimum stable walking platform at three floats wide, 1.5 m or about 59 in. That is a working-surface standard rather than a public-accessibility one; ADA’s 36-inch minimum clear width for pedestrian routes answers a different question. The surface should be anti-slip, the corners rounded, handrails fitted at the working edge. And because the surface is modular, expansion is a purchase decision rather than a rebuild. Connections are indexed by corner, with pins and bolts at numbered corners and longer pins and bolts for double-layer stacks, so adding a row later means ordering another row.
What holds it and what runs to it: mooring, piles, pipes and cables
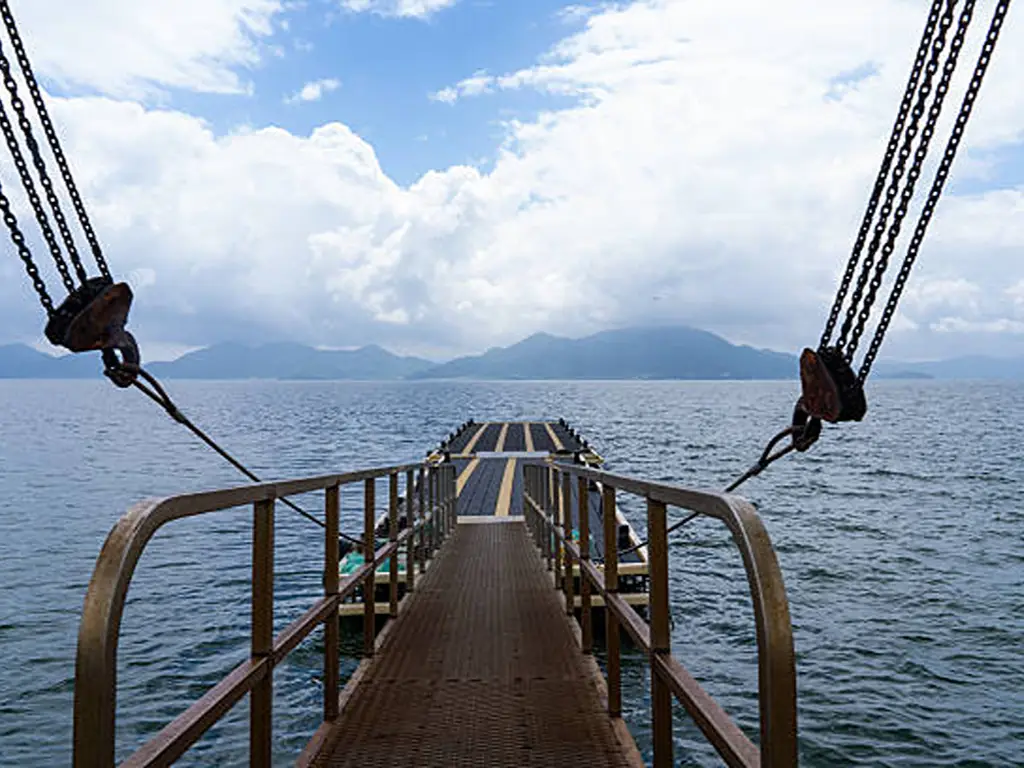
The third layer connects the platform to everything that is not the platform. Mooring takes one of a few forms: pile guides, which accept piles up to a published diameter; deadweight anchors; stiff arms back to a fixed structure; and in open water, a grid mooring of anchors, chain, cable and buoys. Water-level range is the first constraint on all of them: the working surface has to stay workable at the top of the range and at the bottom of it.
Then comes the layer forgotten until commissioning: routing. Power for aeration and feeding, and water lines for service systems, have to travel to the cages. A float with a designated route for a water pipe and a power cable (a pipelined float) keeps those lines out of the walkway and out of the water. That is a small structural choice with an outsized effect on how the farm ages.
| Layer | What to specify | Published baseline | Where it fails |
|---|---|---|---|
| Cage and netting | Mesh size for the target size class; stocking and handling practice | 3/4-inch mesh holds a 3-inch bluegill; at least 18–24 in of water beneath the cage | Small mesh fouls and needs cleaning, and every cleaning stresses the stock |
| Working surface | Load format (per m² or per point), minimum walking width, surface type and handrails | 200–420 kgs/m² by float type; three floats (1.5 m) as the minimum stable width | A per-point load cannot be read off a per-area rating |
| Fixing | Accepted pile diameter, water-level range, mooring approach | Pile guides accept piles up to a stated diameter | Level range exceeds what the guide or mooring can absorb |
| Routing | Provisions for a water pipe and a power cable | A pipelined float routes both | Lines run across the walkway or into the water |
Layer one belongs to the farm’s biology; the other two are usually filed under accessories in a project budget. They are not accessories. They decide whether the farm is still workable in year five, which is why they belong at the top of a buyer’s checklist.
What to Verify Before You Buy: A Buyer’s Checklist
Those three layers produce a short list of things to confirm before an order, and the items share one property: every one is a question a supplier can answer in writing.
Before you buy
One boundary runs one way. A supplier who cannot answer three of those six in writing is not being modest. They are telling you how the next five years will go. Either move on, or write the six answers into the order’s annex and hold the delivery to them.
How This Category Should Be Supplied: Build for a Farm That Grows
Put the pieces together and the supply side of this category has a shape. Growth sits in the volume half of the market: Asia-Pacific, freshwater and warm-water species, small and mid-sized farms. That growth lands on ponds and net pens rather than land-based systems. And a net-pen project, once financed, is a purchase of structure: a working surface, a fixing system, a routing layer.
The industry usually draws the wrong inference here. Headline projects, offshore salmon and land-based RAS, get the press, but they are not this category’s customer; they buy steel and turnkey engineering. For modular platforms, the customer is a farm that grows in phases: a platform and a few cages first, more rows after a season or two. That changes what supply should look like.
Three practical consequences. Supply as modules plus accessories plus expansion parts, not as a single turnkey order. Quote in phases: what the farm can install now, what the next row costs when the time comes. And put the verifiable parameters (load format, walking width, pile range, routing provisions) into the proposal itself, because those are the questions this customer asks before signing, not after.
And say what the category is not. Offshore open water and land-based systems are separate supply chains; a modular float platform’s home is sheltered and nearshore water, at a scale the farm can extend. Saying so is not a limitation. It is the qualification that makes the rest credible.
| Chasing headline projects | Serving farms that grow | |
|---|---|---|
| Customer shape | Vertically integrated producers and state-backed projects | Owner-operated farms, often family-run, in the growth regions |
| First order | Large, engineered, tendered | A platform and a few cages |
| Expansion | Designed once, built once | Modules, connectors and spare parts that keep arriving |
| Where it fails | Biological and financial risk at industrial scale | Handling stress, fouling and price swings: operations, not engineering |
The parts the growth side needs are, not by coincidence, the parts we build. Our float platforms publish their load bands openly, 200 to 420 kgs/m² by type, because a buyer who adds rows over time needs to compare like with like. Our float accessories and spare parts stay available for the same reason: a farm that expands in phases needs them to still exist in year three. Hisea Dock platforms carry a 5-year warranty, free replacement in case of damage within five years, with 24/7 after-sales support behind it. A work surface that fails in season is not a warranty statistic. It is a stopped harvest.
None of that depends on which forecast turns out to be right. Whether the market lands at USD 447 billion or USD 1.15 trillion by the mid-2030s, the farm underneath it is built from the same three layers. Those layers are the one part of the plan that can be bought in phases: the platform you need now, the rows you add later. If you want to check a site’s numbers against published specifications, tell us how your site will grow: the water, the water-level range and the loads the platform has to carry are enough to start.
Spec the platform your farm will grow on
Send your water body, its high-to-low level range and the working loads the platform has to carry. Selection advice and area-based quoting are free.
Send your water and loadsReferences
- FAO. “SOFIA 2026: Global Fisheries and Aquaculture Production Reaches New Highs.” https://www.fao.org/newsroom/detail/sofia-2026–global-fisheries-and-aquaculture-production-reaches-new-highs/en
- USDA National Agricultural Statistics Service. “USDA Releases the 2023 Census of Aquaculture Results.” https://www.nass.usda.gov/Newsroom/archive/2024/12-16-2024.php
- USDA Economic Research Service. “Aquaculture.” https://www.ers.usda.gov/topics/animal-products/aquaculture
- Texas A&M AgriLife Extension / Southern Regional Aquaculture Center. “Cage Culture.” https://fisheries.tamu.edu/aquaculture/cage-culture/
- Chu, Y. et al. “Offshore Fish Farms: A Review of Standards and Guidelines.” Journal of Marine Science and Engineering, 2023. https://www.mdpi.com/2077-1312/11/4/762
- Agricultural Marketing Resource Center. “Offshore Aquaculture Production.” https://www.agmrc.org/commodities-products/aquaculture/offshore-aquaculture-production
- IBISWorld. “Fish & Seafood Aquaculture in the US.” https://www.ibisworld.com/united-states/industry/fish-seafood-aquaculture/63/
- Straits Research. “Fish Farming Market Size, Share & Trends Analysis Report.” https://straitsresearch.com/report/fish-farming-market
- IMARC Group. “Fish Farming Market Size, Share & Forecast Report 2034.” https://www.imarcgroup.com/fish-farming-market
- Expert Market Research. “Fish Farming Market Size, Share, Growth, Forecast 2035.” https://www.expertmarketresearch.com/reports/fish-farming-market
- Zion Market Research. “Fish Farming Market Size, Share, Growth, Opportunities 2034.” https://www.zionmarketresearch.com/report/fish-farming-market
- Allied Market Research. “Fish Farming Market Size, Share, Growth.” https://www.alliedmarketresearch.com/fish-farming-market
- Grand View Research. “Aquaculture Market Size, Share & Trends Report, 2026–2033.” https://www.grandviewresearch.com/industry-analysis/aquaculture-market
- Fortune Business Insights. “Aquaculture Market Size, Share, Trends, Growth Report.” https://www.fortunebusinessinsights.com/aquaculture-market-102100
- Pond Boss Forum. “Caged Fish.” https://forums.pondboss.com/ubbthreads.php?ubb=showflat&Number=400665
- Global Seafood Alliance. “How to Start a Fish Farm.” https://www.globalseafood.org/blog/how-to-start-a-fish-farm/
- Hisea Dock. “Cage Fish Farming Solutions.” https://www.hiseadock.com/waterfront_solutions/cage-fish-farming/
- Hisea Dock. “Modular Floating Dock Cubes.” https://www.hiseadock.com/modular-floating-dock-cubes/
- Hisea Dock. “Pipelined Float.” https://www.hiseadock.com/product-item/pipelined-float/
- Hisea Dock. “Dock Accessories.” https://www.hiseadock.com/dock-accessories/
- Hisea Dock. “Frequently Asked Questions.” https://www.hiseadock.com/faq/
- Hisea Dock. “Contact Us.” https://www.hiseadock.com/contact-us/
- Hisea Dock. “Hisea Dock.” https://www.hiseadock.com/

 English
  Thai
Thai  Spanish
  French
  German
  Dutch
Dutch  Italian
  Arabic
  Indonesian
  Portuguese
  Turkish